
Snowflake, dbt, and tableau on gcp

Motivation
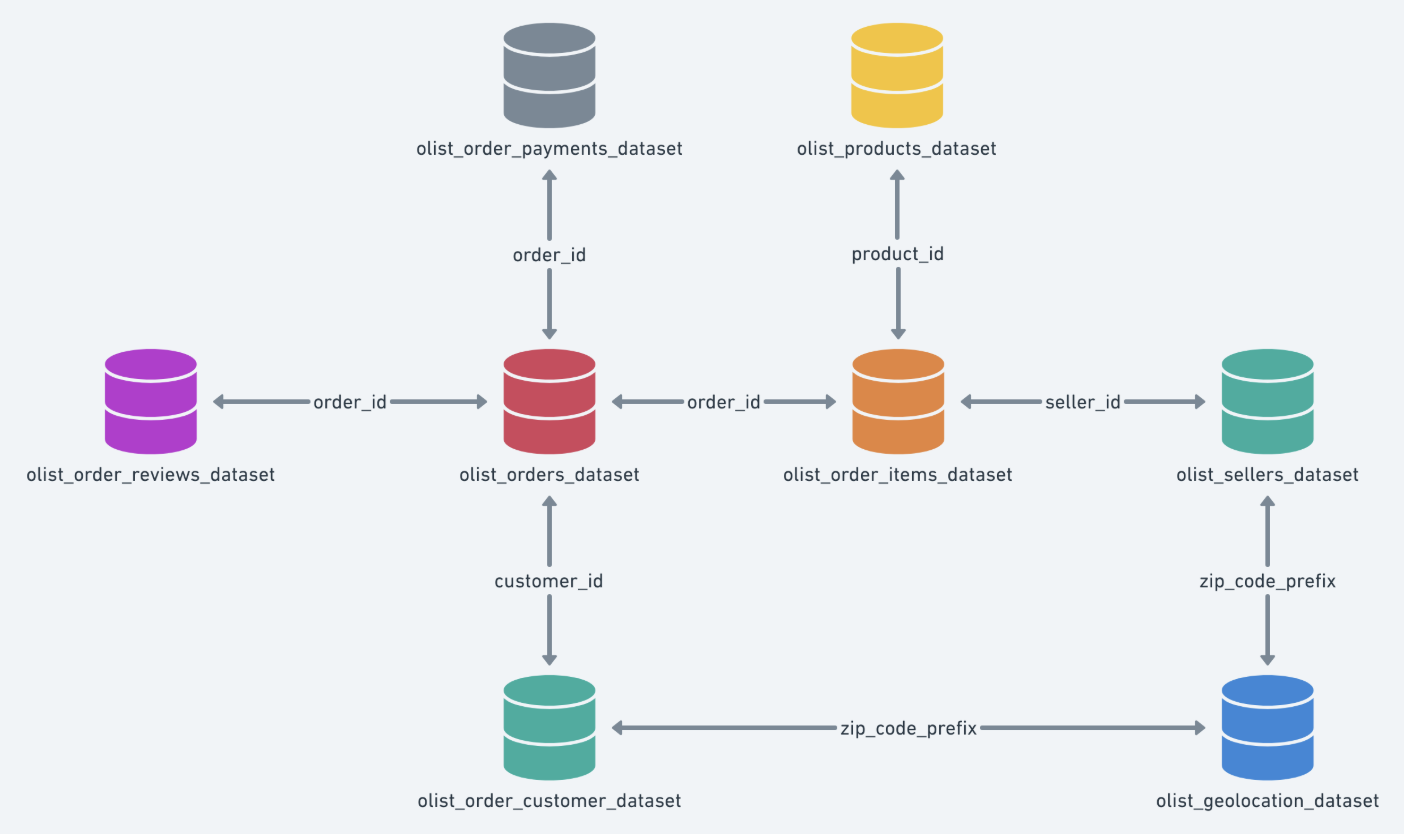
Every data enthusiast dreams of finding that perfect, messy dataset—a real-world puzzle just waiting to be solved. I found mine on Kaggle: the Olist E-Commerce dataset. It was a beautiful beast, containing information on 100,000 orders from Brazil, spread across eight different CSV files. It had everything: orders, items, payments, reviews, customers, products, sellers, and even geolocation data.
Looking at the tangled web of files, I imagined a CEO walking up to me and saying, “I need a single, clean table with our 2017 order information, and I want a dashboard that makes sense of our revenue. Make it happen.” While there was no actual CEO, the challenge was too juicy to pass up. I wanted to build a modern data pipeline from scratch to tame this data beast and turn it into something beautiful and insightful. Challenge accepted.
The Game Plan
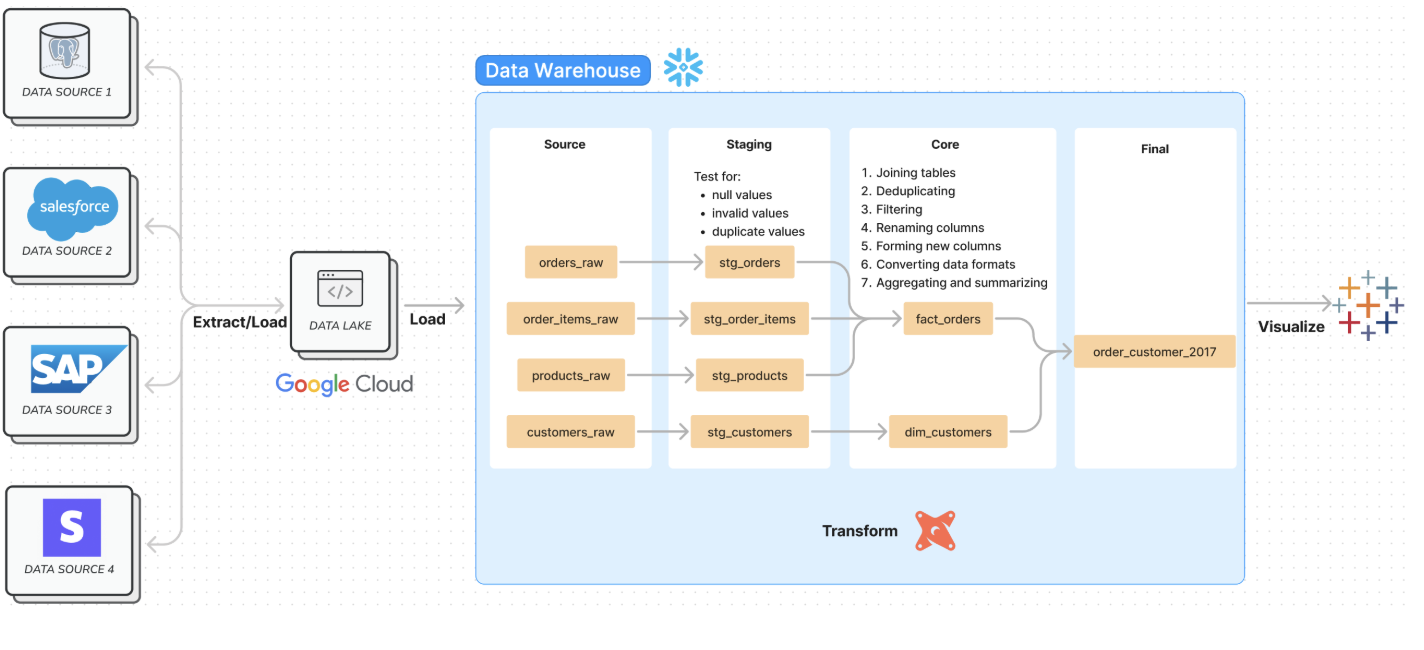
My battle plan was to build an ELT (Extract, Load, Transform) pipeline. Unlike the traditional ETL, we’d load the raw data into our warehouse first and then transform it. Think of it like this:
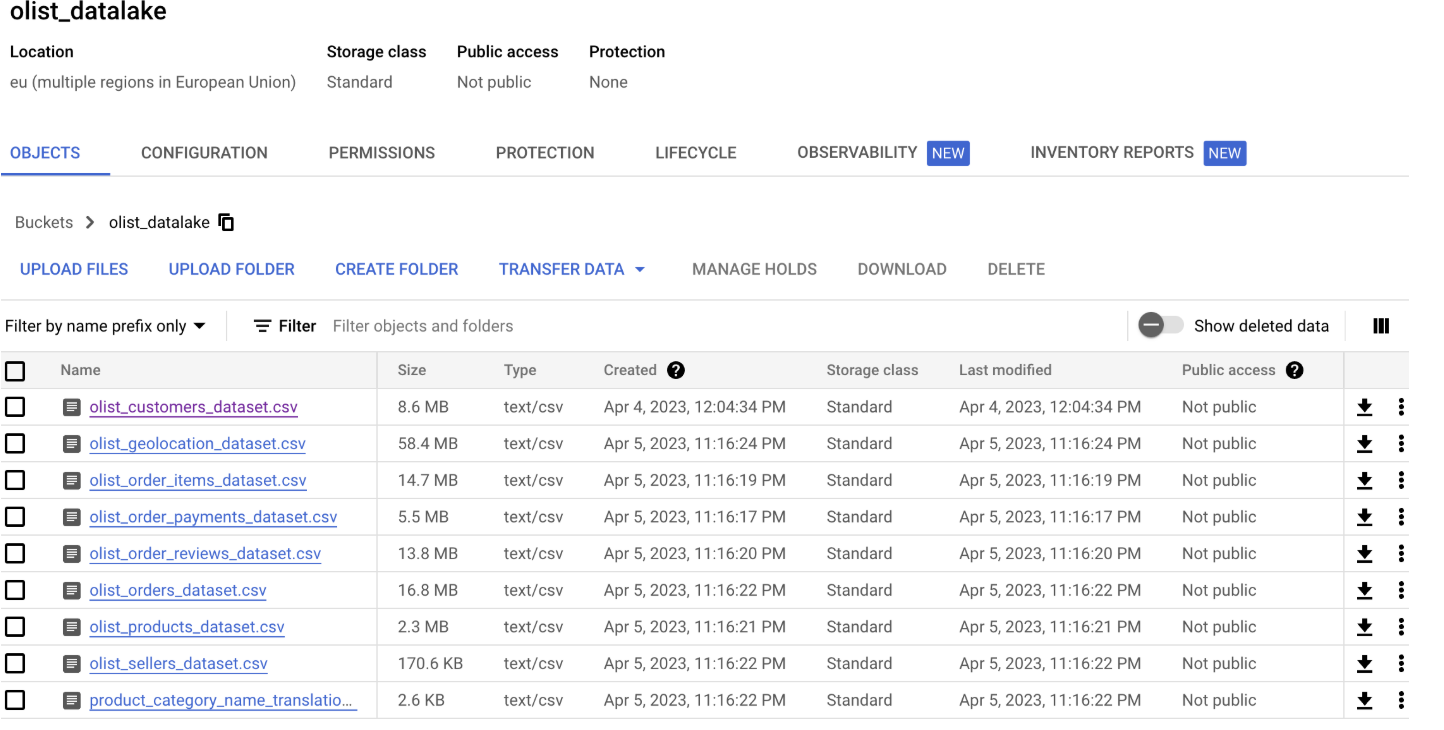
- Extract & Load (The Data Dump): First, I’d get the raw data and dump it into a “data lake.” I chose Google Cloud Storage for this—a central place to hold all the messy, unstructured files before the real work began.
- Load (The Workshop Setup): Next, I’d move the data from the lake into a powerful, cloud-based data warehouse: Snowflake. This would be our pristine workshop where the magic happens.
- Transform (The Assembly Line): This is where my secret weapon comes in: dbt (data build tool). Instead of writing complex, hard-to-maintain SQL scripts in the warehouse, I’d use dbt to build a clean, tested, and modular “assembly line” to transform the raw data into a final, polished table.
- Visualize (The Grand Finale): With a perfect table ready, the final step was to connect it to Tableau and build a dashboard that told a compelling story about Olist’s 2017 performance.
Step 1: The Data Dump (Google Cloud Storage)
First things first, I needed a home for my eight unruly CSV files. I downloaded the dataset from Kaggle and immediately tossed it into a Google Cloud Storage (GCS) bucket. No cleaning, no peeking—just a straight-up data dump. Think of it as the digital equivalent of throwing everything in the garage to sort out later. Step one, achieving controlled chaos, was complete.
Step 2: Building the Workshop (Snowflake)
With the raw materials staged, it was time to construct our data workshop in Snowflake. This involved a bit of digital architecture:
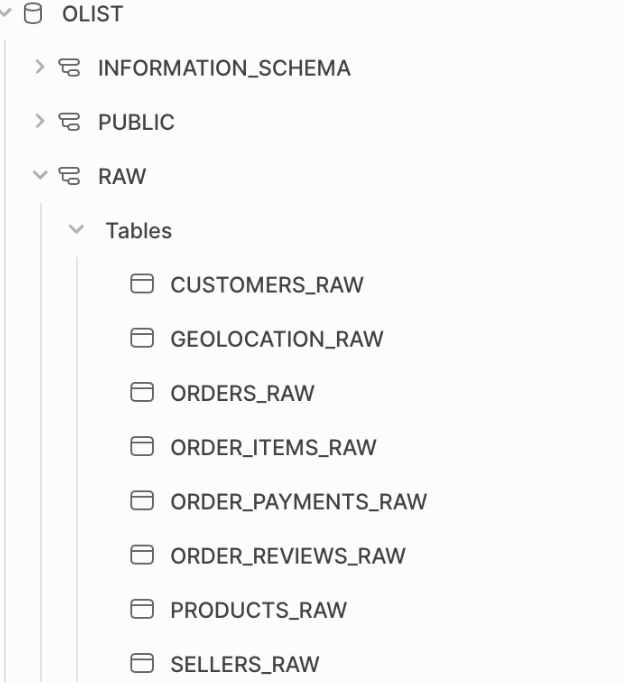
Creating a new virtual warehouse (olist_wh) to provide the computing power. Setting up a new database (olist) and schema (olist_raw). Defining user roles and permissions to keep things secure. Then came the big move. I configured an integration between Snowflake and GCS, allowing Snowflake to directly access the files in my data lake. Using a series of CREATE TABLE and COPY INTO commands, I pulled each of the eight CSV files into our olist_raw schema. The raw materials were now on the factory floor, ready for processing.
Here’s a snippet of what loading one of the tables looked like:
-- Create and load data to 'orders_raw' table
CREATE OR REPLACE TABLE orders_raw (
    order_id string,
    customer_id string,
    order_status string,
    order_purchase_timestamp timestamp,
    ...
);
COPY INTO orders_raw
FROM @gcs_olist_stage
    PATTERN = 'olist_orders_dataset.csv'
    FILE_FORMAT = (type = 'CSV' skip_header = 1 FIELD_OPTIONALLY_ENCLOSED_BY = '"');
After running these commands for all eight files, our workshop was officially open for business.
Step 3: The dbt Assembly Line
This is where the real fun began. Instead of a monolithic SQL script, dbt lets you break down your transformations into small, manageable models that reference each other. It’s like building with LEGOs.
The Staging Layer: Quality Control
The first stop on my assembly line was the “staging” layer. I created a simple model for each raw table that did little more than select all the data. The crucial part here was adding tests. Using a simple YAML file, I could enforce rules on my data.
models:
  - name: stg_customers
    columns:
      - name: customer_id
        tests:
          - unique
          - not_null
  - name: stg_orders
    columns:
      - name: order_status
        tests:
          - accepted_values:
              values: ['delivered', 'invoiced', 'shipped', 'processing',
                       'unavailable','canceled','created', 'approved']
This code tells dbt: “Hey, make sure every customer_id is unique and not empty. Also, check that the order_status is one of these eight specific values.” If a test fails, dbt stops the entire process, preventing bad data from moving downstream. No bad parts allowed on my assembly line!
The Core Layer: Building Components
Next up was the “core” layer, where I started combining my prepped parts into more useful components. I built two key models:
dim_customers: A “dimension” table that cleaned up customer information. fact_orders: A “fact” table that joined orders, items, and products to calculate key metrics. I used dbt’s handy ref() function to build dependencies. For example, to build dim_customers, I just had to ref(‘stg_customers’), and dbt automatically knew how to build things in the right order.
Here’s a peek at how I cleaned up the customer_state abbreviations in dim_customers.sql:
-- dim_customers.sql
WITH customers AS (
    SELECT * FROM
)
SELECT
    customer_id,
    customer_unique_id,
    ...
    CASE
        WHEN customer_state = 'SP' THEN 'São Paulo'
        WHEN customer_state = 'RJ' THEN 'Rio de Janeiro'
        ...
    ELSE 'Tocantins'
    END AS customer_state
FROM customers
The Final Layer: The Finished Product
For the grand finale of my dbt pipeline, I joined the core models (fact_orders and dim_customers) into one glorious, wide table called order_customers_2017. This single table contained everything the (hypothetical) CEO asked for: cleaned-up order and customer data, filtered down to just the year 2017, and ready for its close-up.
With all my dbt models defined, it was time to start the factory. A single command in my terminal set everything in motion:
dbt run
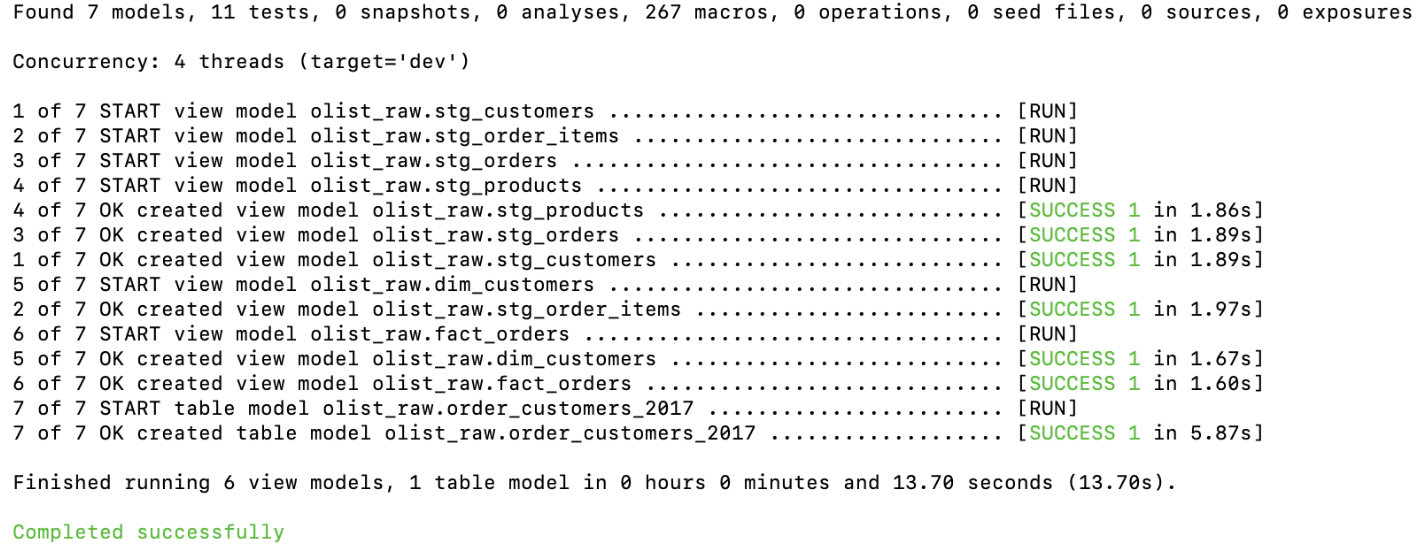
Like magic, dbt connected to Snowflake, ran all my SQL models in the correct order, and materialized them as views and tables. My pipeline was alive! But was the data any good? Another simple command gave me the answer:
dbt test
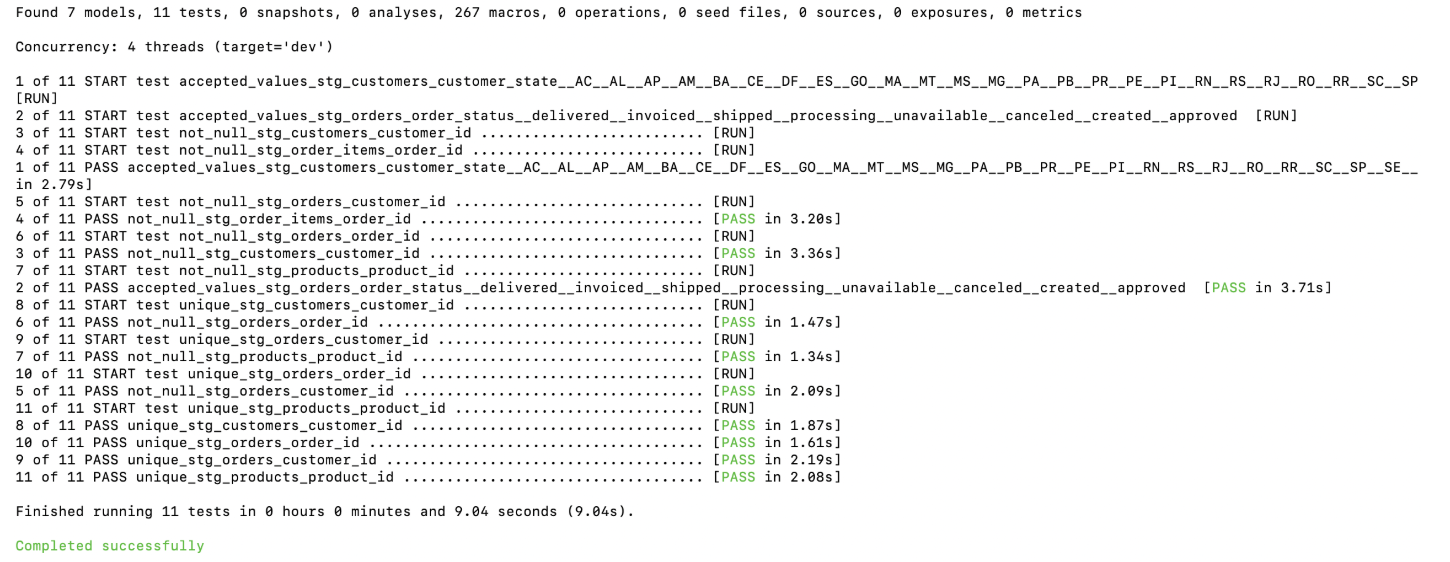
All 11 tests passed. My data was clean, validated, and ready for the spotlight.
The Grand Finale: A Dashboard is Born
The heavy lifting was over. I fired up Tableau, connected it to my new order_customers_2017 table in Snowflake, and started dragging and dropping. My goal was a clean, intuitive dashboard that provided a snapshot of Olist’s business in 2017.
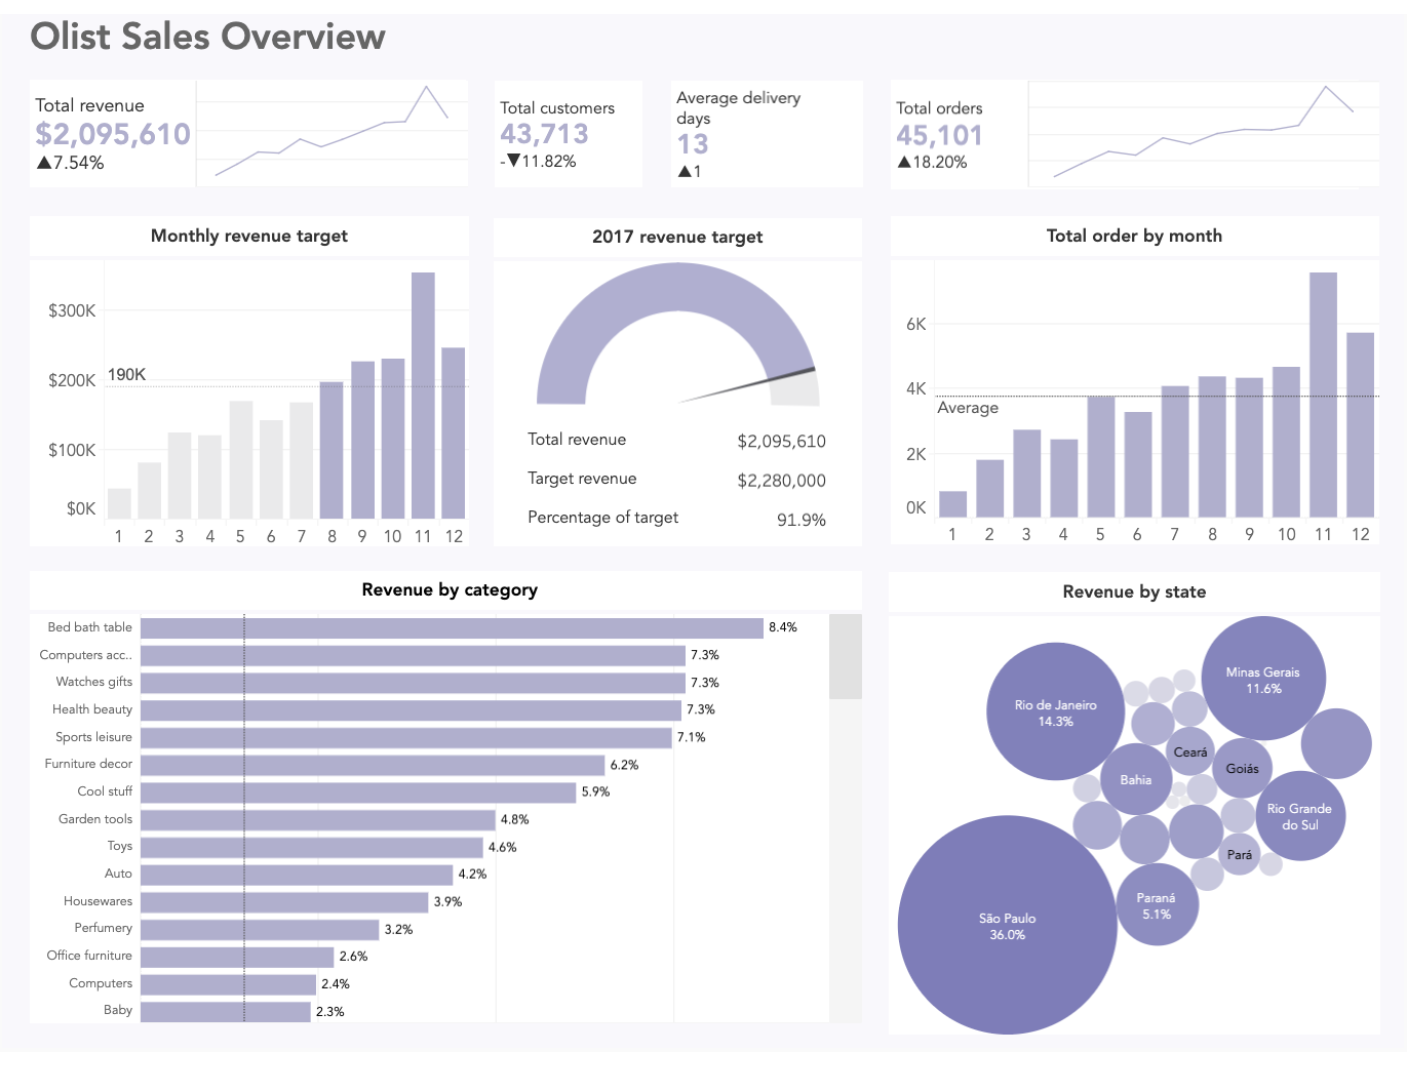
A few insights jumped out immediately:
Loyal Spenders: Total revenue and orders grew throughout the year, but the number of unique customers actually decreased. This suggests that repeat customers were spending more money per order. Holiday Rush: The business saw a huge spike in both orders and revenue in the second half of the year, peaking in November. Geographic Concentration: A whopping 70% of revenue came from just four of Brazil’s 26 states. The Hits: The top 10 product categories accounted for over 63% of all revenue.
Conclusion and Future Quests
This project was a fantastic journey from a chaotic mess of files to a fully functional, automated ELT pipeline and an insightful dashboard. It cemented my love for the modern data stack. The combination of Snowflake’s power, dbt’s elegance and reliability, and Tableau’s visualization capabilities is truly a game-changer.
Of course, the work is never truly done. In a “version 2.0,” I would love to:
Schedule the pipeline to run automatically with a tool like Apache Airflow or dbt Cloud. Write more advanced, customized data tests to ensure even higher data integrity. Add a year filter to the dashboard to make it interactive across different time periods. For now, though, I’m thrilled with the result. I took on a challenge, tamed a beast of a dataset, and built something genuinely useful from scratch. And that, for any data person, is a very good day at the office.